BATTERY SCIENCE LAB / EVERYDAY TECHNOLOGY
Why the Final Percentage Takes Longer
Explore the chemistry, electrical controls, and charging strategies that make batteries charge quickly at first and more slowly as they approach full capacity.
Imagine plugging in your smartphone when its battery is almost empty.
During the first part of charging, the percentage may rise surprisingly quickly. But as the display approaches 90% or 100%, the process often becomes noticeably slower.
Electric vehicle drivers experience something similar. A vehicle may add substantial driving range during the early part of a fast-charging session, then require much longer to reach a full charge.
This behavior is not necessarily a sign of a faulty battery or charger.
For many modern lithium-ion batteries, slowing down near full charge is a deliberate part of the charging process.
The main reason is that battery charging must become more carefully controlled as the cell approaches its upper voltage limit.
To understand why, it helps to examine how batteries store energy, what charging curves represent, and how electronic systems protect the cells.
What Happens Inside a Battery During Charging?
Most modern smartphones, laptops, and electric vehicles use some form of rechargeable lithium-ion battery.
These batteries store and release energy through electrochemical reactions.
A typical lithium-ion cell contains two electrodes, an electrolyte, and a separator.
During charging, an external power source drives lithium ions through the electrolyte toward the negative electrode.
Electrons travel through the external electrical circuit, allowing the electrochemical process to continue.
During discharge, the overall process reverses and the battery supplies electrical energy to the device.
Charging is therefore more complicated than simply pouring electricity into an empty container.
The cell’s voltage, temperature, chemical composition, and internal condition all influence how quickly it can safely accept energy.
What Is a Battery Charging Curve?
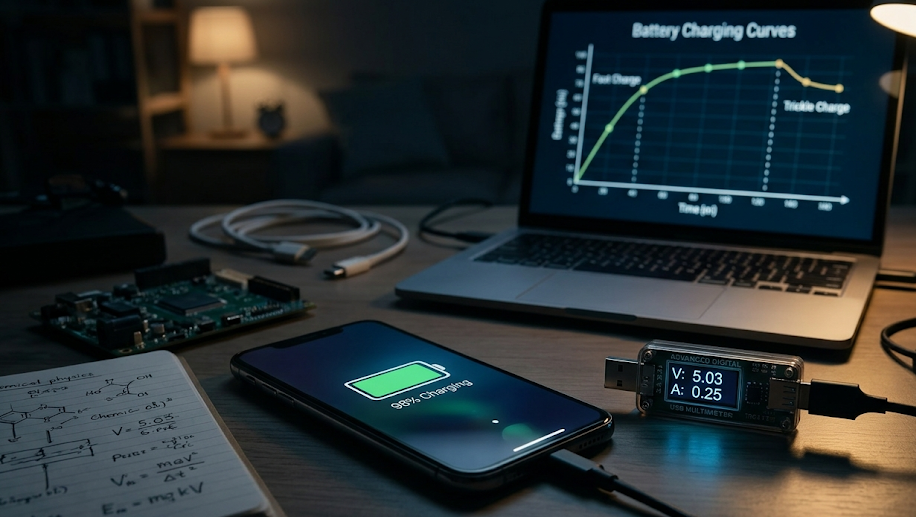
A charging curve shows how a battery’s charging behavior changes over time or with its state of charge.
Depending on the graph, it may display charging current, battery voltage, charging power, or the percentage of energy stored.
For example, an electric vehicle charging curve often shows charging power against battery state of charge.
A laboratory charging curve may show voltage and current over time.
These graphs help explain why charging speed is not constant.
A battery may accept relatively high current during one stage and substantially less during another.
Its exact charging curve depends on battery chemistry, temperature, age, charger capabilities, and the control strategy chosen by the manufacturer.
LAB NOTE / CHARGING SPEED
Charging Power Is Not the Same as Battery Percentage.
Battery percentage estimates how full a battery is. Charging power describes the rate at which energy is being delivered. A battery can continue gaining percentage while charging power gradually decreases.
The Two Main Stages of Lithium-Ion Charging
A common charging method for lithium-ion cells is known as constant-current, constant-voltage charging, often abbreviated as CC-CV.
The process contains two important stages.
Stage 1: Constant-Current Charging
During the constant-current stage, the charging system supplies a controlled current to the cell.
As the battery charges, its voltage gradually rises.
This stage can account for much of the energy added during a charging session.
When conditions allow, relatively high charging current makes the early portion of charging faster.
However, the current is not necessarily identical under all conditions.
Real devices may adjust it according to temperature, battery condition, and other limits.
Stage 2: Constant-Voltage Charging
Once the cell reaches its specified upper charging voltage, the charger controls the voltage near that limit.
As charging continues, the current naturally decreases.
This reduction in current slows the rate at which additional energy enters the battery.
The process continues until a defined termination condition is reached.
This is one of the central reasons the final portion of lithium-ion charging can take longer than expected.
The transition between stages is determined by the cell’s electrical conditions, not by a universal percentage such as exactly 80%.
Why Does Charging Current Decrease Near Full Capacity?
As a lithium-ion cell approaches full charge, its voltage approaches the maximum level allowed by its design.
Continuing to force high current into the cell could push its voltage beyond the intended limit.
Excessive voltage can accelerate unwanted chemical reactions and create safety concerns.
In the constant-voltage stage, the charger limits the applied voltage.
As the cell’s electrochemical state changes, the current required to maintain that voltage decreases.
Charging therefore tapers naturally under the control of the charging system.
Additional protective limits may further reduce current when the battery is hot, cold, aged, or otherwise unable to accept high charging rates.
The result is a charging process that prioritizes controlled operation rather than maintaining maximum speed until the display reaches 100%.
Why 80% Is Often an Important Charging Milestone
Many smartphone and electric vehicle charging discussions emphasize the 80% level.
This is partly because fast charging often becomes less efficient in terms of time spent waiting as the battery approaches a high state of charge.
However, 80% is not a universal scientific boundary.
Some batteries begin reducing charging power well before that point.
Others maintain relatively high power beyond it under suitable conditions.
The charging strategy depends on cell chemistry, thermal management, battery pack design, and manufacturer settings.
For electric vehicles, charging to around 80% may be a convenient travel strategy when additional charging time would be disproportionate to the extra range gained.
But the best stopping point depends on the vehicle, charger, route, and driving needs.
A Simplified Charging Curve Example
The following table illustrates how charging power might decrease as a hypothetical battery approaches full charge.
The values are examples only. They do not represent a specific phone, laptop, electric vehicle, or battery chemistry.
| Battery State of Charge | Illustrative Charging Power | General Behavior |
|---|---|---|
| 10% | 100 kW | High-power charging |
| 30% | 100 kW | High power maintained |
| 50% | 85 kW | Power begins tapering |
| 70% | 60 kW | Reduced charging power |
| 85% | 35 kW | Stronger taper |
| 95% | 15 kW | Slow final charging stage |
The table demonstrates why charging from 10% to 50% may take considerably less time than charging through a similar percentage range near the top of the battery.
Charging power is only one part of the calculation.
Actual charging time also depends on battery capacity, charging efficiency, temperature, and how the power changes between measured points.
How Battery Management Systems Control Charging
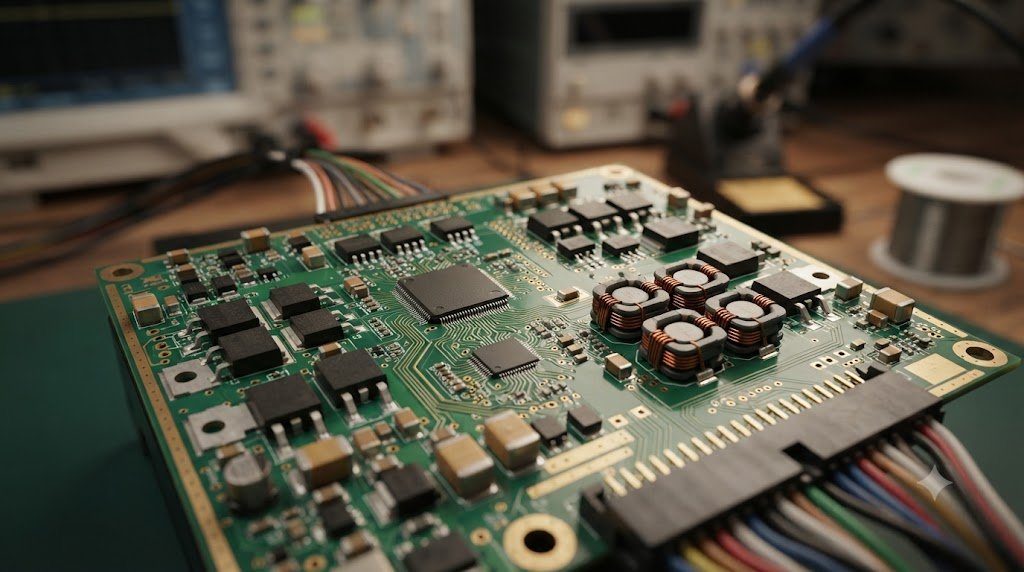
Modern rechargeable devices use electronic systems to manage battery operation.
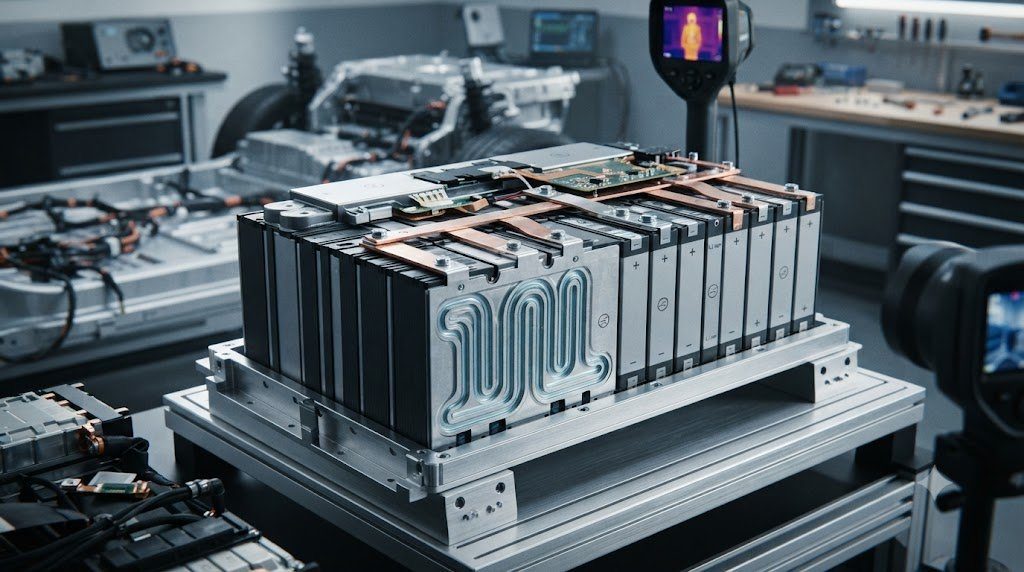
In electric vehicles and many larger battery packs, these functions are handled by a battery management system, or BMS.
The system monitors important conditions such as cell voltage, temperature, and current.
It may estimate state of charge and assess operating limits.
When necessary, the system can request reduced charging power or stop charging.
In multi-cell battery packs, management systems may also support cell balancing.
Balancing helps manage differences between cells so that individual cells remain within their permitted voltage ranges.
These controls are particularly important because the behavior of a battery pack depends on the condition of its individual cells.
Why Heat Can Make Charging Slower
Temperature strongly affects battery performance.
Charging generates heat through electrical resistance and electrochemical processes.
High temperatures can accelerate battery degradation and may require protective reductions in charging current.
Cold temperatures create different challenges.
At low temperatures, lithium-ion cells may accept charge less readily.
Charging too aggressively under unsuitable cold conditions can increase the risk of lithium plating, where metallic lithium deposits on the negative electrode.
For these reasons, battery systems may limit charging speed when temperatures are outside the preferred operating range.
Some electric vehicles use battery heating or cooling systems to improve charging conditions.
Phones and laptops may also reduce charging power when their internal temperatures become elevated.
Why Fast Charging Cannot Stay Fast Forever
Fast charging delivers energy at a higher rate than slower charging methods.
However, the battery must be able to accept that energy safely.
Even if a charger can supply very high power, the device may request less.
The charging rate is limited by the complete system, including the charger, cable, battery cells, electronics, and thermal conditions.
For example, connecting a smartphone to a charger with a high advertised wattage does not guarantee that the phone will use all that power.
The device controls how much power it accepts.
Similarly, an electric vehicle connected to a powerful DC fast charger may charge below the charger’s maximum rating.
As the battery fills, the permitted charging power often declines.
Why Electric Vehicles Charge Slowly Near 100%
Electric vehicle batteries contain many individual cells organized into modules or packs.
These cells must remain within specified electrical and temperature limits.
During DC fast charging, the vehicle communicates its permitted charging requirements to the charging equipment.
As the pack approaches a high state of charge, charging power commonly decreases.
Cell balancing, thermal conditions, and pack voltage limits may influence the process.
This explains why the final portion of a charging session can take disproportionately long.
For drivers making long journeys, shorter charging stops may sometimes be more time-efficient than waiting for a full charge at every station.
However, charging strategy should account for the vehicle’s actual range, available chargers, weather, and route requirements.
Do Smartphones and Laptops Behave the Same Way?
Smartphones and laptops also use controlled lithium-ion charging systems.
They commonly reduce charging current as the battery approaches its upper voltage limit.
However, their charging behavior is not identical to that of electric vehicles.
Battery size, cell chemistry, heat dissipation, and charging electronics differ considerably.
Some devices also include optimized charging features.
These features may delay charging beyond a selected percentage until closer to the time the device is expected to be used.
Such behavior is separate from the normal electrical taper associated with lithium-ion charging.
A phone that pauses at a certain percentage may therefore be following a battery-care schedule rather than experiencing a charging problem.
Does Charging to 100% Damage a Battery?
Charging a modern device to its indicated 100% is generally part of its intended operating design.
Manufacturers include protective controls to prevent cells from exceeding specified limits during normal operation.
However, lithium-ion batteries gradually age through use and over time.
Spending extended periods at high states of charge, especially in hot conditions, can accelerate certain aging processes.
For some users, limiting routine charging to a lower percentage may help reduce long-term battery stress.
But charging to 100% can still be appropriate when maximum operating time or driving range is needed.
It is also important to distinguish between the percentage shown on the screen and the cell’s actual electrochemical limits.
Manufacturers may reserve some capacity through software-defined buffers.
The displayed 100% does not necessarily represent the absolute physical maximum that the cells could theoretically reach.
Why Battery Percentage Is Only an Estimate
The battery percentage displayed on a phone, laptop, or vehicle is not a direct measurement of stored energy.
It is an estimate produced using electrical measurements and battery models.
Systems may consider voltage, current, temperature, and the battery’s operating history.
Because battery behavior changes with age and conditions, estimating state of charge accurately can be challenging.
This helps explain why the displayed percentage does not always increase at a perfectly uniform rate.
It also means that the final percentage point is not necessarily an exact, fixed quantity of usable energy under every condition.
Practical Tips for Better Battery Charging
BATTERY CARE / PRACTICAL CHECKLIST
Choose chargers and cables that meet the device manufacturer’s specifications.
Keep devices within recommended temperature ranges and avoid trapping heat during charging.
Consider optimized charging or charge-limit settings when available and suitable for your routine.
A slower charging rate near full capacity is often normal for lithium-ion batteries.
Different battery chemistries and products may have different charging recommendations.
Frequently Asked Questions
Why does charging slow down after 80%?
Many lithium-ion charging systems reduce current or power as the battery approaches its upper voltage limit. The exact point where slowing begins varies by device.
Is slow charging near 100% normal?
Yes. Controlled charging near full capacity is normal for many lithium-ion devices.
Does a more powerful charger eliminate the slowdown?
No. Charging speed is limited by the battery and its control electronics as well as the charger.
Why do electric vehicles take longer to charge from 80% to 100%?
Charging power often decreases substantially at high states of charge to keep cells within electrical and thermal limits.
Should I always stop charging at 80%?
Not necessarily. Lower routine charge limits may reduce some forms of battery stress, but charging to 100% can be useful when maximum range or operating time is needed. Follow the manufacturer’s recommendations.
Can cold weather slow battery charging?
Yes. Battery systems often limit charging current at low temperatures to protect the cells.
What does CC-CV mean?
CC-CV stands for constant-current, constant-voltage. It describes a common charging method used for lithium-ion cells.
Final Thoughts
The slowdown near 100% is one of the most recognizable features of modern battery charging.
It occurs because lithium-ion batteries cannot safely accept unlimited charging current as they approach their upper voltage limits.
During a common CC-CV charging process, the charger initially controls current and later maintains a voltage limit while current decreases.
Battery management electronics also monitor conditions such as temperature and cell voltage.
These systems help protect the battery while allowing it to store energy efficiently.
The precise charging curve differs between devices, but the underlying principle remains important: charging speed must be balanced against electrical, chemical, and thermal limits.
Understanding this process explains why the last few percentage points may take longer—and why that slower finish is often part of a properly functioning battery system.